The Deliverables
Executive TechnicalEngagement §04 lists eight things you receive. Here is one real example of each, drawn from Coastal_Property.bayes, the same 12-node model used on the Inference page.
Coastal_Property.bayes is a property-insurance portfolio model: twelve nodes running from Climate Trend and Storm Season through Building Age, Material Condition, and Code Compliance, into Flood Damage, Claim Severity, Rate Adequacy, Portfolio Loss, and Reinsurance Cost. The examples below are representative, illustrating the format and rigor of each artifact, not disclosing a named client's numbers. But every mechanism shown (the graph, the schema, the inference direction, the sensitivity check) is the real one this practice uses.
01 The Causal Map
The Model Itself
A diagram of what drives what, reviewed and signed off by the named experts. This is the artifact executives use. Nobody needs to open Bayes Server to read it.
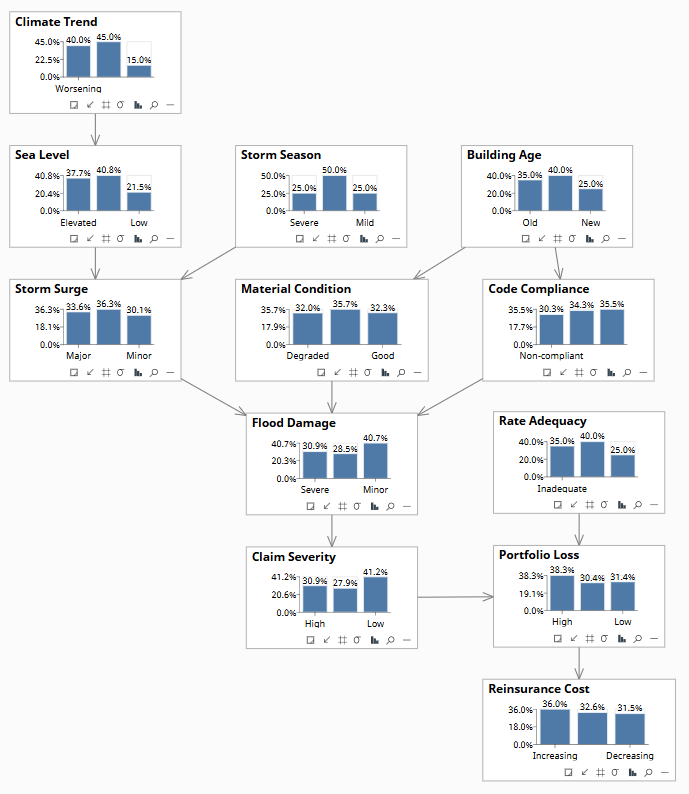
This is the model itself, open in Bayes Server, prior state, no evidence set. Each bar chart is one node's elicited distribution: Climate Trend at top-left showing 40% Worsening, down through Storm Surge, Material Condition, and Code Compliance into Flood Damage, Claim Severity, Portfolio Loss, and finally Reinsurance Cost. Reading left to right along any row is reading the graph your experts signed off on.
This is a real screenshot of Coastal_Property.bayes open in Bayes Server, not a redrawn diagram. In an engagement, the causal map you receive is this same view, with every bar traceable back to the expert session that set it.
02 The Model File
The Model Itself
Runs in Bayes Server. It is yours, no licence to me, no dependency on my continued involvement. Set evidence, run inference, and read the posterior directly.
12 nodes, 12 links, discrete 3-state variables throughout. Supports observational (Rung 1), interventional (Rung 2), and counterfactual (Rung 3) queries, the same file used for the forward, backward, and do() examples on the Inference page.
03 The Scope Card
The Model Itself
A plain statement of what the model covers: which factors, which population, which kinds of question it can answer. It defines the model’s boundary so nobody applies it where it does not belong. This is the same Scope Card schema specified in EARA §5.2, filled in for this model.
Population, assumptions, and signatories are representative. A real engagement's Scope Card names the actual experts and the actual regime. The schema, the fields, and the fact that no model is invoked without one, are exactly as specified.
04 The Validation Report
The Evidence It Works
What was checked mathematically, and what was checked against real outcomes, reported separately, per the Validation component: reliability diagrams, held-out log-score, and do() predictions compared against observed interventions. Where only the first was possible, the report says so.
Figures are representative of the format this report takes, not a specific client's audited numbers. Where a real engagement lacks a matched cohort for the interventional check, the report states that plainly rather than substituting a correlational proxy.
05 The Robustness Report
The Evidence It Works
Which conclusions still hold if an expert’s estimate was wrong, per the Robustness component: perturb the CPTs, re-run, measure what changed. This is the section a regulator reads first.
| Check | Method | Result |
|---|---|---|
| Sensitivity | ±15% perturbation of the elicited Code Compliance → Flood Damage CPT | The conclusion that do(Code Compliance = Compliant) lowers expected Portfolio Loss held under every perturbation tested. The direction is robust even if the exact magnitude the underwriters gave was off |
| Necessity of evidence | Re-run the Portfolio Loss = High attribution with each upstream node's evidence removed in turn | Removing Storm Season evidence changed the upstream posterior by a small margin, not necessary for this attribution. Removing Code Compliance evidence changed it substantially. That node was load-bearing |
Why This MattersThe regulator's question is never "is the model right?" It's "how much of your recommendation depends on a number one expert guessed?" This report answers that directly, per conclusion, rather than asserting the model is generally trustworthy.
06 The Elicitation Records
The Evidence It Works
Where every number came from and who supplied it. Provenance for the whole model. As the Inference page puts it: "The node probabilities were elicited from your underwriting and actuarial teams. I am not generating these numbers. I am reading them from the model."
| Node | Elicited From | Method |
|---|---|---|
| Storm Surge | Catastrophe modeling lead | Structured interview against historical surge data by coastal segment |
| Material Condition | Senior property inspector | Structured interview + inspection-report sample review |
| Code Compliance | Underwriting lead | Structured interview against permit and retrofit records |
| Claim Severity | Claims director | Structured interview, cross-checked against five years of settled claims |
| Rate Adequacy | Actuarial lead | Structured interview against current rate filings |
Names above are role titles, not individuals. A real elicitation record names the actual person, the actual session date, and the actual model version each number entered under. That specificity is the point: two years from now, a re-elicitation starts from what these people said last time, not from nothing.
07 The Worked Question Set
Using and Keeping It
Real questions from your business, run end to end, each with the full record of how the answer was reached. These three are the same worked examples shown on the Inference page, reproduced here as deliverable entries rather than illustrations.
“Portfolio Loss came in High this quarter. What upstream factors does that implicate?”
Evidence entered at Portfolio Loss = High and propagated upstream through Claim Severity, Flood Damage, and their parents. Answer derived from Coastal_Property.bayes; audit trail is the model file plus its elicitation record.
“If we required Code Compliance across the portfolio, how much would that actually move Portfolio Loss?”
do(Code Compliance = Compliant) severs the edge from Building Age, isolating the effect of enforcement itself rather than the selection effect of which buildings happen to already comply. This is the query correlation cannot answer.
“Given the current Climate Trend and Storm Season outlook, what should we expect for Claim Severity?”
Evidence enters at the upstream nodes and propagates forward through Storm Surge, Material Condition, and Code Compliance to a posterior over Flood Damage and Claim Severity, the prediction direction, run before the season rather than after it.
08 The Runbook
Using and Keeping It
How to add a factor, re-run the elicitation, and tell when the model needs revisiting, so the model outlives the engagement.
Adding a factor. Example: your reinsurer starts pricing on treaty terms directly. (1) Identify its parents and children in the existing graph, here a new node feeding Reinsurance Cost alongside Portfolio Loss. (2) Elicit its CPT with the relevant expert, following the same structured-interview method used for the original 12 nodes. (3) Re-run the validation and robustness checks on any downstream node the new factor touches. (4) Bump the model version and reissue the Scope Card.
Re-running the elicitation. Reconvene the named experts from the original Elicitation Records. Walk each node's current CPT past them and ask only whether it still matches how the system behaves, not whether the model's conclusions "feel right." Log every change with who made it and why.
Knowing when to revisit. Three triggers: the model's predictions start missing systematically (a validation-report signal), the population shifts (a new coastal region enters the portfolio), or a structural assumption breaks (Code Compliance stops being observable the way it was elicited). Any one of these is sufficient on its own. Don't wait for all three.