NIST CSF 2.0
Executive TechnicalEvery NIST CSF assessment tells you your Govern tier. Almost none tell you how much that governance gap is costing you in suppressed returns on every other control you’ve already bought, or which single investment would lift all of them.
The NIST CSF plug-in, vocabulary, structure, and the questions your leaders ask, already mapped. Nothing here starts from a blank page.
The QuestionHow much is a governance gap suppressing returns on controls you've already funded?
The MethodA causal model connecting the Govern tier to downstream control effectiveness.
The AnswerA single investment identified as lifting the return on every other control at once.
01 The Decision
A REGIONAL HEALTH SYSTEM WAS ALIGNED TO CSF. Their CISO had $4.2M to allocate across Protect and Detect, two of the six CSF functions covering preventive controls and threat detection. The maturity assessment said both needed investment. The causal model said one would cut breach probability by 61%. The other by 11%.
A framework with six functions can’t tell you which one to fund first. The maturity assessment was accurate: Protect and Detect were both Tier 2, both needed investment, both were identified as priorities. What the assessment structurally could not produce was a causal answer: given that Govern is also at Tier 2, what is the return on a Detect investment versus a Protect investment for this specific system, in this specific posture, with this specific threat profile?
| Analysis Component | Standard Approach | Causal Approach |
|---|---|---|
| Return on Protect vs Detect | Both Tier 2; recommend raising both; no mechanism to compute differential impact | do(Protect): P(major breach) 34% → 13% (−61%). do(Detect): 34% → 30% (−11%). Mechanism: Govern at Tier 2 suppresses Detect’s return |
| Counterfactual on prior breach | Post-mortem recommends investment across all contributing factors with equal weight | do(MFA deployed): P(breach) = 0.08, 91% reduction, dominant cause. do(Detect=Tier3): P(contained <4hrs) = 0.73, meaningful, but secondary |
| Insurance premium optimisation | Cannot answer, maturity scores do not encode underwriting logic | Protect allocation produces $2.9M annual premium reduction |
02 The solution
CSF 2.0 formalized what practitioners already knew: Govern is not one of six equal functions. It is the parent of all five others. A weak governance function degrades every downstream capability regardless of point-solution spending. The maturity assessment showed Govern at Tier 2. It did not show that Govern’s weakness was suppressing the return on every other investment. The causal model did.
The solution was to model the relationships between the variables that determine security posture, and to be explicit about which variables cause which. We recognised, for example, that Govern is not one of six equal functions, it is the upstream cause of all five others. A weak governance function suppresses the return on every downstream investment regardless of how much is spent on point solutions, which means observing poor detection performance tells you something about governance, not just about detection tooling. Budget allocation influences outcomes, but it is itself influenced by governance maturity, making it a mediator rather than a root cause. When you observe a variable in this model, you are effectively filtering the data to cases where that variable takes a particular value, and that filter ripples through the model, shifting related variables up and down accordingly. When you intervene on a variable, forcing it to a value regardless of what caused it, you break that ripple effect and get a cleaner answer: not what organisations that look like this tend to experience, but what would happen if this specific control were improved When you abduct, you extract a particular case from the averages, locking in its idiosyncratic circumstances before asking what would have happened if one or more things had been different.
Govern has no direct edge to Security Incident, it works only through its children. A Tier 2 Govern function suppresses Detect return because threat monitoring findings have no clear escalation path. The maturity assessment cannot show this. A causal model with directed edges from Govern to Detect to breach probability can.
| CSF Function | Current | Target | Assessment Rationale |
|---|---|---|---|
| Govern | Tier 2 | Tier 3 | Risk strategy documented; needs stronger board oversight and supply chain risk integration |
| Identify | Tier 3 | Tier 3 | Asset inventory mature; maintain current practices |
| Protect −61% breach | Tier 2 | Tier 3 | MFA incomplete across clinical systems; endpoint hardening below benchmark |
| Detect −11% breach | Tier 2 | Tier 3 | No 24/7 SOC coverage; SIEM coverage gaps on medical devices |
| Respond | Tier 3 | Tier 3 | Playbooks current; tabletop exercises completed Q2 |
| Recover | Tier 2 | Tier 3 | Backup testing frequency below policy; DR plan not tested against ransomware scenario |
A maturity assessment scores nodes. A causal model connects them. Detection without governance is a siren with no one listening. Recovery without containment is rebuilding on fire. Those connections change the return on every investment.
03 What the solution answers
- Would MFA have prevented the prior breach: or would Tier 3 detection have contained it?: Rung 3. Abduct to actual event conditions, apply each intervention independently.
- If we invest $4.2M in Protect, what does breach probability become vs the same investment in Detect?: Rung 2. do() separates the causal effect from the Govern confound.
- What is our current exposure: and given Severe Business Impact, what does the graph tell us about upstream Govern maturity?: Rung 1. Evidence propagates in both directions.
| Scenario | Major Breach | Annual Loss | Insurance |
|---|---|---|---|
| Status quo | 34% | $8.1M | 62% Adverse |
| $4.2M → Detect | 30% (−11%) | $6.4M | 58% Adverse |
| $4.2M → Protect | 13% (−61%) | $3.2M | 31% Adverse |
| $2.8M Protect + $1.4M Govern Chosen | 9% (−74%) | $2.2M | 22% Adverse |
| Contributing Factor | Post-Mortem | Counterfactual Model |
|---|---|---|
| MFA not deployed | “Root cause” | P(breach|MFA) = 0.08, 91% reduction. Dominant cause. |
| SIEM alert not actioned 38 hrs | “Contributing” | P(contained<4hrs) = 0.73, meaningful, but only if breach occurs. |
| Vendor credentials not rotated | “Contributing” | P(breach|rotated) = 0.21, material but not dominant. |
| DR untested for ransomware | “Contributing” | P(recovery>72hrs) = 0.68 vs 0.15, affects cost, not whether breach occurs. |
Investing in DR to prevent the next breach would have been a category error. The post-mortem gave equal weight to all four. The model did not.
04 Inside the Model
A language model can speak fluently about any domain. It cannot know one. The .bayes file is the knowledge the LLM is missing: a causal map of the domain, auditable, versioned, and wrong in specific correctable ways.
Optionally open NIST-CSF-gaussian.bayes in Bayes Server. 15 nodes, 22 edges. The model is the thing; the software that runs it is a commodity. Govern fans out to all five operational functions. Incident pathway: Security Incident → Incident Detection → Incident Response. Consequence nodes: Business Impact, Regulatory Exposure, Insurance Outcome.
Nodes show Gaussian distributions on a 0–100 scale. Black checkmark = observed evidence. Red checkmark = do() intervention.
Rung 3, Counterfactual: would MFA have prevented the breach?
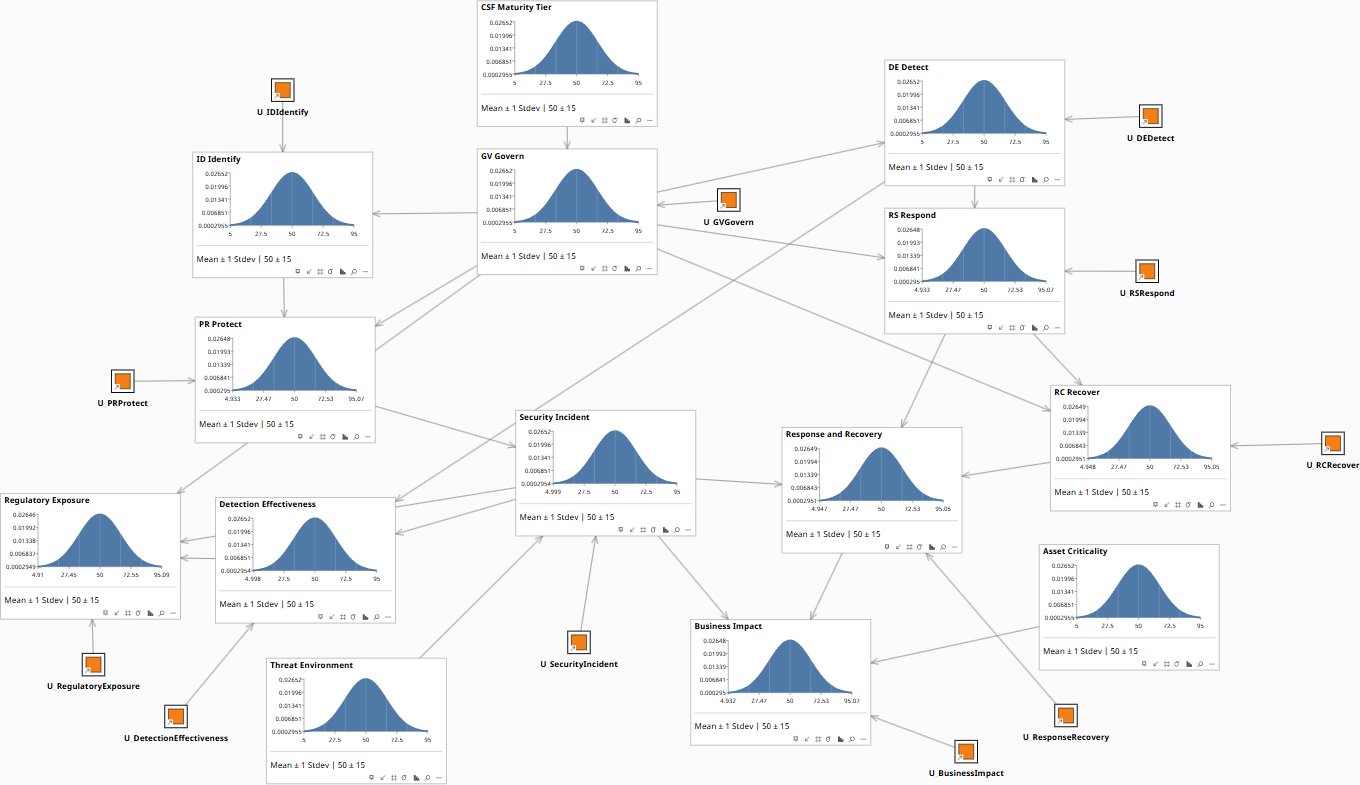
Prior marginals. Major incident probability: 18.9%. All nodes at prior.
Rung 2, Intervention: Protect vs Detect investment
Baseline before any investment intervention. Major breach probability: 34%. Expected annual loss: $8.1M.
Rung 1, Association: diagnostic and predictive inference
Prior marginals. Major incident probability: 18.9%.
05 Just Ask
The model is a file. Any capable LLM can load its XML and answer NIST CSF budget and post-incident questions in plain English.
Same model, three rungs. The audit trail is the .bayes file, not a PowerPoint that recommends everything and prioritizes nothing.
- Maturity roadmap. What is the next-highest-value tier improvement after this one?
- Audit prioritization. Which control's ROI is most sensitive to the current governance gap?
- Benchmark comparison. How does our tier-to-ROI relationship compare to sector peers?
- Budget defense. What is the expected loss if this investment is deferred another year?
- Cascading return. Does improving this tier reduce risk in a control we have not directly funded?
06 The Engagement
Build the causal model on your CSF posture. Parameterize it from your incident history, sector breach data, and your security team’s expert judgment. Deliver a model that tells the board which investment, not just that investment is needed.
- Insurance underwriters already think causally. Protect investments reduce premium; Detect investments reduce claims. The model quantifies the difference before your renewal conversation, $2.9M annual premium reduction in this case.
- Regulators are converging on CSF. SEC disclosure, CIRCIA, NIS2, DORA, all align with or reference the framework. “We funded Protect because the model showed 61% vs 11% given our governance maturity” survives scrutiny. “Both were Tier 2 so we split the budget” does not.
- Post-incident review requires counterfactuals. A maturity assessment cannot answer “what should we have done differently?” A causal model answers it with probabilities, not opinions.
This case study is a composite drawn from published healthcare cybersecurity assessments and NIST CSF implementation patterns. Specific figures are representative. No individual organisation, incident, or regulatory proceeding is described.
The Deeper Trade
The model does not replace the expert who built it. It frees her from being the bottleneck for every routine version of this question, so she can spend her judgment on the cases that actually need it, and keep making the model better.