Marketing Mix
Executive TechnicalWhich channels are actually driving sales, corrected for the seasonal demand that inflates every channel’s apparent ROI, so budget follows cause, not correlation.
The Marketing plug-in, vocabulary, structure, and the questions your leaders ask, already mapped. Nothing here starts from a blank page.
The QuestionWhich channels are actually driving sales, not just correlated with a good season?
The MethodA causal model separating channel effect from the seasonal demand that confounds every channel's apparent ROI.
The AnswerA budget allocation that follows cause, not a correlation every channel can equally claim credit for.
01 The Decision
MODERN MARKETING-MIX MODELS: Robyn, Meridian, the major vendor platforms, are regressions. They produce confident-looking numbers, with confidence intervals wide enough to span very different realities. The point estimate gets carried into the budget meeting; the uncertainty gets left on the dashboard.
The gap matters because media spend is never randomly assigned. Advertisers spend more in Q4 because they expect Q4 sales. They push TV in growing markets because the markets are growing. A naive regression of sales on spend doesn’t measure “where did sales lift because of money”, it measures “where did money go because we expected sales.” The coefficient absorbs the strategic intent that drove the budget and reads it back as media effectiveness. This is the back-door confounding problem. Every MMM has it.
The visible symptom: confidence intervals on individual channels of $0.73 to $7.42 per dollar of spend: wide enough to span “this is a great channel” and “this is a money pit.” The point estimate that arrives in the budget meeting carries an apparent precision the underlying data doesn’t support.
On a $50M annual TV budget, Robyn’s 41% overstatement implies roughly $20M of incremental revenue that won’t materialise. The bridge brings the estimate within sampling noise of truth.
02 The solution
The solution was to model the relationships between the variables that drive revenue, and to be explicit about which variables cause which. We recognised, for example, that seasonal demand is a confounder: it drives both media spend and sales simultaneously, which means the observed correlation between advertising and revenue overstates the causal effect of the advertising. Brand equity influences how effectively each paid channel converts, which means channels that happen to run during high-equity periods look more effective in the data than they actually are. When you observe a variable in this model, you are effectively filtering the data to cases where that variable takes a particular value, and that filter ripples through the model, shifting related variables up and down accordingly. When you intervene on a variable, forcing it to a value regardless of what caused it, you break that ripple effect and get a cleaner answer: not what periods that look like this tend to produce, but what would happen if this specific channel budget were changed When you abduct, you extract a particular case from the averages, locking in its idiosyncratic circumstances before asking what would have happened if one or more things had been different.
Robyn is regression. The bridge adds the causal structure regression can’t infer from data alone, the back-door confounder, the do-operator semantics, the counterfactual decomposition, and corrects each channel toward its true causal effect rather than its observed correlation.
Three deliverables, all interactive in a tool the marketing team uses for budget meetings:
Corrected ROIs per channel
For every paid channel, the bridge reports Robyn’s reported ROI alongside the structural ROI that accounts for the back-door confounder, with the size of the gap shown in dollars.
Per-campaign attribution
For any historical campaign, the bridge decomposes observed sales into the share causally attributable to the campaign versus the share that would have happened anyway.
Sensitivity-analysed allocation
A budget reallocation recommendation paired with an honest account of how it changes as the assumptions change. Drag a slider and watch the optimal mix move.
03 What the solution answers
Robyn observes the joint distribution of spend and sales. P(Sales | TV_spend), what sales look like when TV spend is already high, is not the same as P(Sales | do(TV_spend)).
Robyn reports TV ROI at $2.83. Accurate description of the observational relationship. Wrong quantity to optimise a budget against.
do(TVSpend = X) severs the back-door from MarketConditions. What remains is the unconfounded structural ROI the budget decision should be made against.
Structural TV ROI: $1.84. Search ROI: $1.95. Newsletter: near zero. The ranking flips, Search is structurally better than TV. The gap between $2.83 and $1.84 is the budget allocation error that compounds every quarter.
Abduct the Q4 background market conditions from the period’s actuals, then do(TVSpend = baseline) and read the counterfactual sales.
Of the Q4 uplift, roughly 35% was causally attributable to TV spend. The remaining 65% would have occurred because Q4 conditions were already buoyant. Strong sales and effective TV are not the same thing.
04 Inside the Model
A language model can speak fluently about any domain. It cannot know one. The .bayes file is the knowledge the LLM is missing: a causal map of the domain, auditable, versioned, and wrong in specific correctable ways.
Optionally open MarketingMixSCM-AllRungs.bayes in Bayes Server. The model is the thing; the software that runs it is a commodity. Built from a Robyn fit on 200 weeks of synthetic data with known structural ROIs: TV $2.00, Search $4.00, Newsletter $0.00.
The live Shiny app lets you explore interactively, drag the lambda slider and watch per-channel ROI bars update in real time:
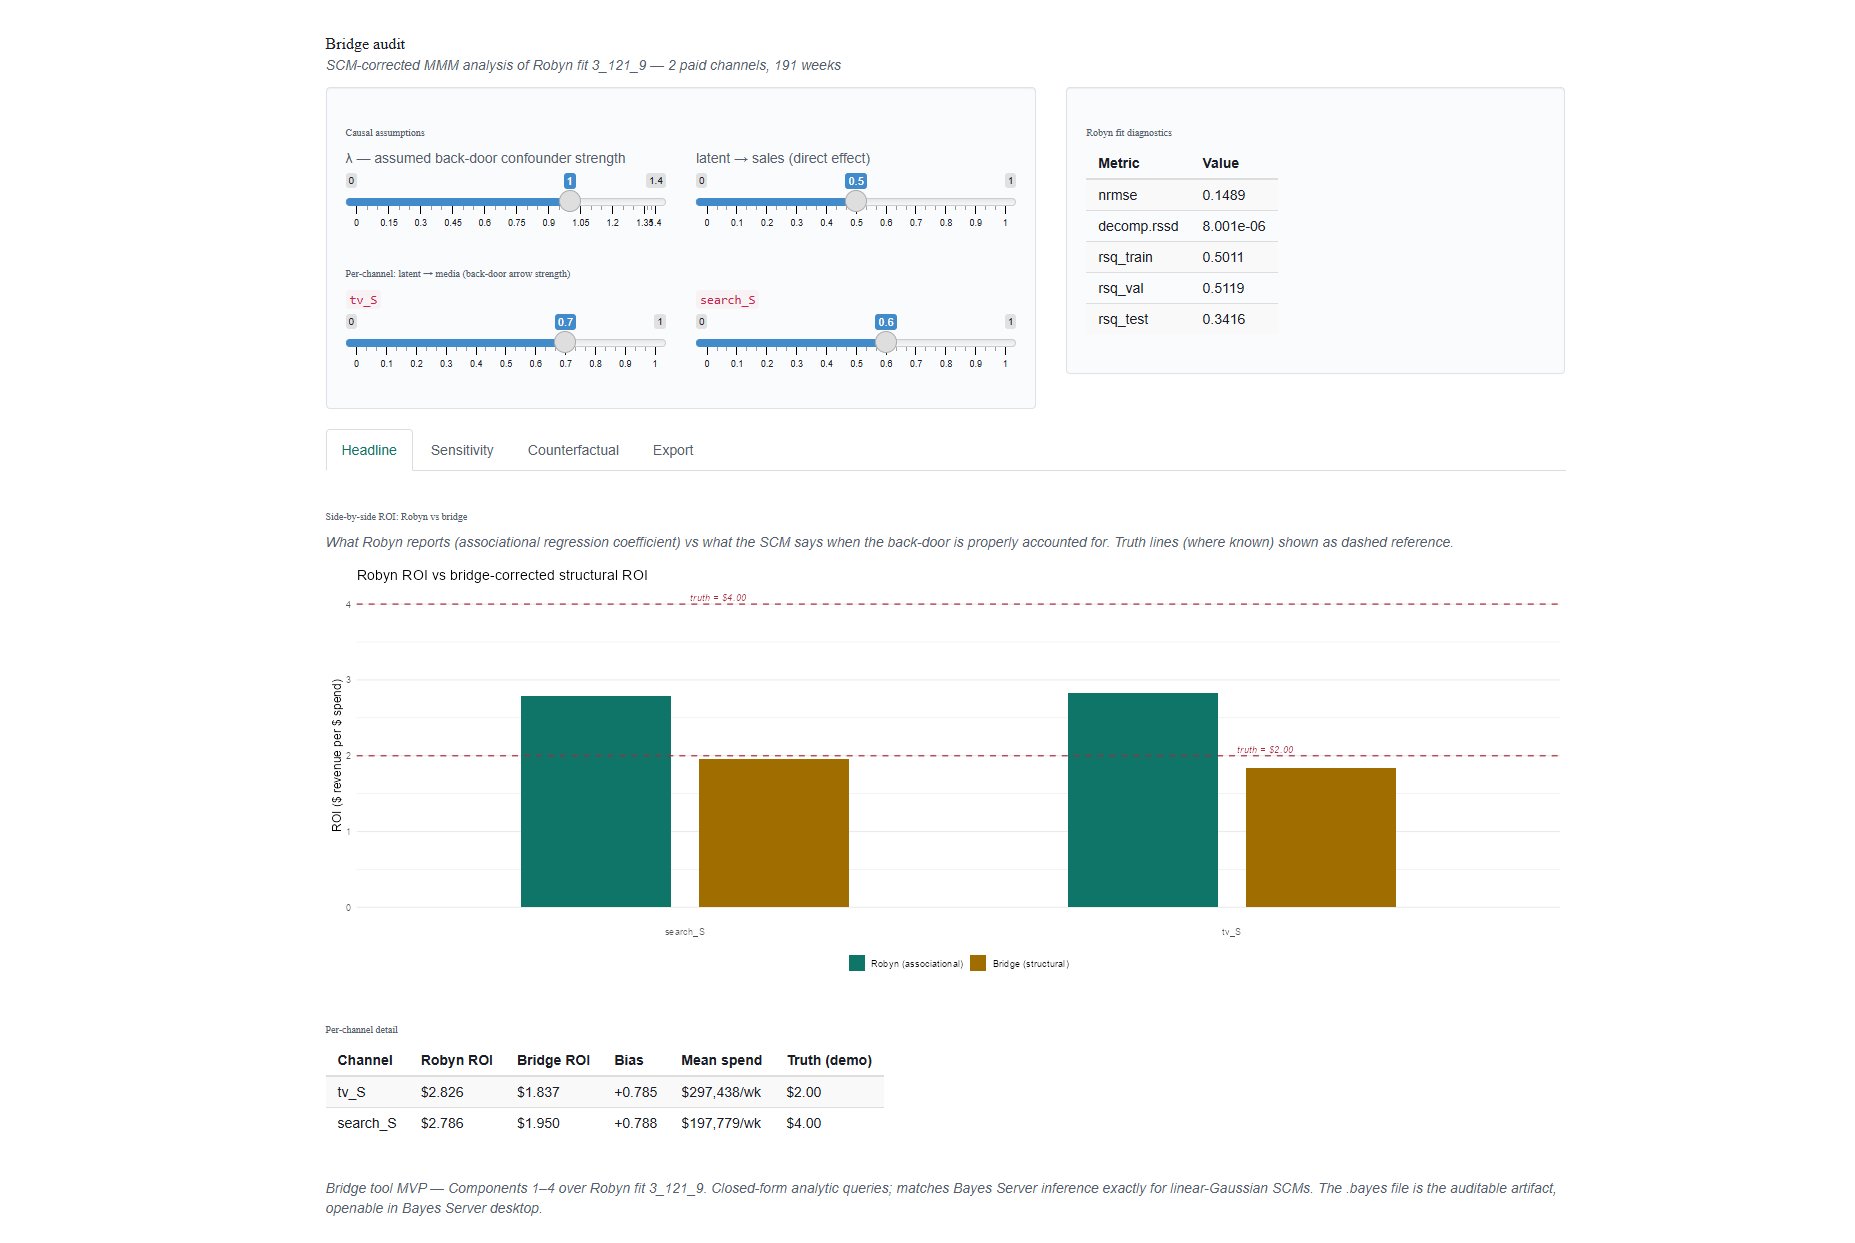
TV: Robyn $2.83, bridge $1.84, truth $2.00. Search: Robyn $2.79, bridge $1.95, truth $4.00.
05 Just Ask
The model is a file. Any capable LLM can load its XML and answer marketing-mix questions in plain English.
Same model, three rungs. The audit trail is the .bayes file.
- Budget reallocation. What is the optimal channel mix for next quarter, corrected for seasonality?
- Incrementality test. Would a matched holdout confirm the model's channel-effect estimate?
- New market entry. Which channel would most likely replicate this performance in an untested region?
- Competitive read. How much of this channel's apparent lift is actually a competitor's absence?
- Durability check. Does this channel's causal effect hold at ninety days, not just at the point of sale?
06 The Engagement
Four weeks. The deliverable is a working bridge tool configured for your business, plus a quarterly refresh cycle.
Map your media-planning process, channel taxonomy, and experimentation history.
Elicit causal elasticity priors per channel from experiments and benchmarks.
Build the SCM in Bayes Server, fit against your Robyn output, run diagnostic checks.
CMO-facing audit report, configured Shiny app, quarterly refresh documentation.
Pricing: $40–80K single-geo mid-market. Larger advertisers $80–150K. Quarterly refreshes $15–30K.
This case study uses a synthetic dataset with known structural ROIs. No individual client or engagement is described.
The Deeper Trade
The model does not replace the expert who built it. It frees her from being the bottleneck for every routine version of this question, so she can spend her judgment on the cases that actually need it, and keep making the model better.